AI Predictive Analytics in Healthcare: A Practical Guide
Healthcare analytics is constrained first by what data may legally move. How masking, prediction and explainability fit together in practice.
Supaboard AI Blog7 min read
80 stories
Healthcare analytics is constrained first by what data may legally move. How masking, prediction and explainability fit together in practice.
Manufacturing analytics joins machine telemetry to commercial outcomes. Where predictive maintenance pays back, and where it quietly does not at all.
Retail KPIs work in four layers: sales, inventory, customer, margin. How to read them together so that a revenue drop always gets the right response.
Ask a data question in plain English and get a real answer back. How NLQ works, where it earns its keep, and the prerequisite that vendors gloss over.
Bar graphs compare categories, histograms show distribution. The differences, worked examples, and the reorder test that settles which you need.
Self-service BI moves questions closer to the people asking them. What it changes, what it costs in governance, and when traditional BI wins.
Enterprise BI is defined by governance as much as by analysis. The use cases, the tools, and why definitions matter far more than the dashboards do.
Real-time analytics narrows the gap between what happens and what you know. How it differs from business activity monitoring, and when to buy.
Cart abandonment is several problems, not one. How to instrument the funnel, segment before concluding, and find failed payments hiding in it.
Business intelligence turns operational data into decisions people actually make. What it covers, how it evolved, and why most BI failures are definitional.
Over the past year, NTT DATA's Innovation Center collaborated with Bifrost AI to evaluate whether synthetic data could accelerate AI model development while maintaining or improving quality and reducing costs.
Remove data validation in Excel in 4 clicks: select cells, go to Data > Data Validation > Clear All > OK. Works for drop-down lists, rules, and entire sheets.
Run rate is a financial forecasting metric that projects a company's future performance by extrapolating its current revenue over a longer period of time, usually an entire year. For startups, it's a quick way to estimate annual revenue based on limited data.
Churn rate measures the percentage of customers or accounts that cancel or fail to renew within a given period. For subscription businesses, it’s one of the clearest signals of customer retention, recurring revenue stability and long-term growth potential.
A guide for non-technical users on how to create compelling narratives with data.
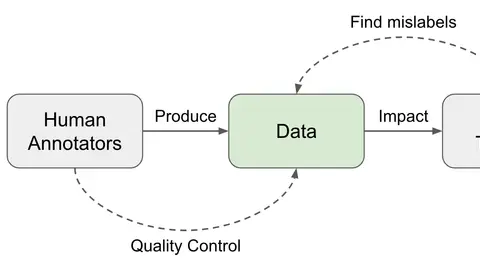
[Special thank you to Ian Kivlichan for many useful pointers (E.g. the 100+ year old Nature paper “Vox populi”) and nice feedback. 🙏 ] High-quality data is the fuel for modern data deep learning model training.
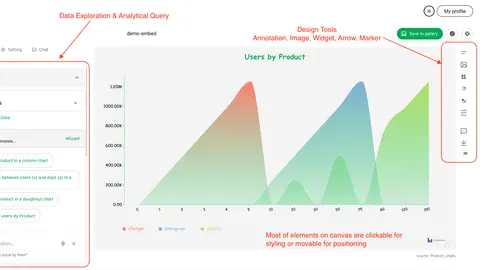
As a blog writer, do you dream about embedding a live data graph in your article? It shines your content to be more attractive and makes it much more digestible for your readers, also it makes it more worthwhile for your readers to share with others.
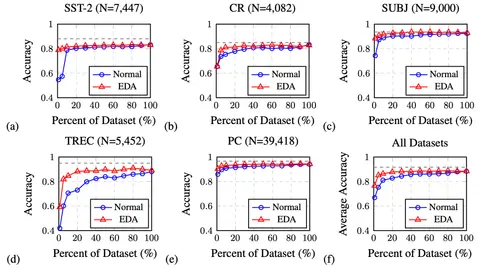
Here comes the Part 3 on learning with not enough data (Previous: Part 1 and Part 2). Let’s consider two approaches for generating synthetic data for training. Augmented data.
Showing 72 of 80 stories
Load more storiesGet the top AI news and tools straight to your inbox every week.
Weekly · AI news
Join 15,000+ AI enthusiasts