
Know a great AI tool or AI news source? Submit it to AiByts

matplotlib

3 stories

Stories

  • Triple Pendulum CHAOS!

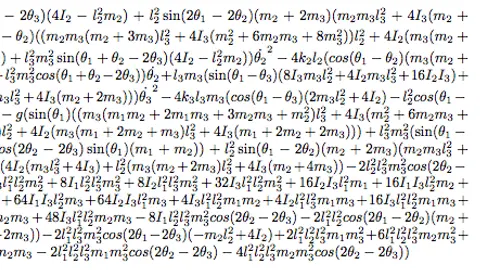
    Earlier this week a tweet made the rounds which features a video that nicely demonstrates chaotic dynamical systems in action: A visualization of chaos: 41 triple pendulums with very slightly different initial conditions pic.twitter.com/CTiABFVWHW— Fermat's Library (@fermatslibrary) March 5, 2017…

    Python Data Science Handbook by Jake VanderPlas Blog8 min read
  • How Bad Is Your Colormap?

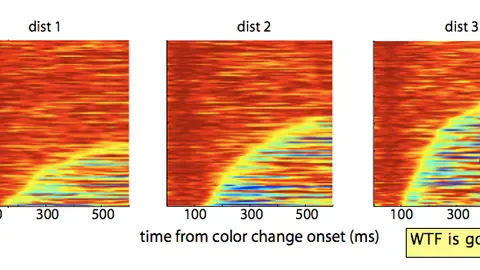
    (Or, Why People Hate Jet – and You Should Too) I made a little code snippet that I find helpful, and you might too: """Return a grayscale version of the colormap""" cmap = plt.cm.get_cmap(cmap) colors = cmap(np.arange(cmap.N)) # convert RGBA to perceived greyscale luminance # cf.

    Python Data Science Handbook by Jake VanderPlas Blog5 min read
  • D3 Plugins: Truly Interactive Matplotlib In Your Browser

    It's been a few weeks since I introduced mpld3, a toolkit for visualizing matplotlib graphics in-browser via d3, and a lot of progress has been made. I've added a lot of features, and there have also been dozens of pull requests from other users which have made the package much more complete.

    Python Data Science Handbook by Jake VanderPlas Blog9 min read

Showing 3 of 3 stories

You're all caught up.

AiByts Weekly Brief

Get the top AI news and tools straight to your inbox every week.

Weekly · AI news

Join 15,000+ AI enthusiasts