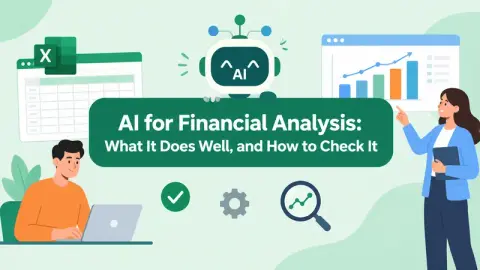
金融分析のためのAI:その長所と検証方法
AIを財務分析に使うのにデータ専門家である必要はありません。どの業務を担えるか、数値をどう確認するか、どこで止めるべきかを知っておく必要があります。
Excelmatic Blog15 min read
24 stories
AIを財務分析に使うのにデータ専門家である必要はありません。どの業務を担えるか、数値をどう確認するか、どこで止めるべきかを知っておく必要があります。
現在是這個月的第三個工作日。你有一份來自會計系統的預算與實際支出匯出檔,其中一半的部門被人重新命名了,還有一份上個月的供應商發票 PDF,以及你主管傳來的一則訊息,全文是:「有什麼變化?」
You do not need to be a data specialist to use AI for financial analysis. You need to know which tasks it handles, how to check the numbers, and where to stop.
AIは、数値が信頼できる前にExcelレポートを完成したように見せかけることができます。このレビューワークフローを使って、入力を追跡し、KPIを再計算し、事実と推測を区別しましょう。
AI can make an Excel report look finished before the numbers are trustworthy. Use this review workflow to trace inputs, recalculate KPIs, and separate facts from guesses.
接続されたAIダッシュボードとExcel/CSVワークフローを比較。実用的な判断ガイド、レビュー用プロンプト、ダッシュボード共有前のチェックを活用。
Compare connected AI dashboards with Excel and CSV workflows. Use a practical decision guide, review prompt, and checks before sharing a dashboard.
了解如何從 Excel 檢閱 AI 儀表板:定義 KPI、追溯至來源列、測試邊界案例,並在檔案工作流程與 BI 之間做選擇。
Learn how to review an AI dashboard from Excel: define the KPI, trace it to source rows, test edge cases, and choose between a file workflow and BI.
A practical guide to choosing the right data analysis tool for your workflow, from Excel and BI dashboards to AI tools that analyze Excel, CSV, PDF, and business exports.
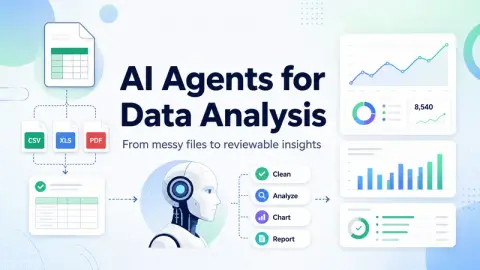
AI agents for data analysis are useful only when they can work with real business files, explain their reasoning, and produce outputs teams can review.
Claude in Google Sheetsはシート内作業に有用です。この比較では、財務チームが代わりにExcel AI、ファイルベースの分析ワークフロー、レビュー可能なレポートを必要とする場面を示します。
Claude in Google Sheets 適合試算表內作業。此比較說明財務團隊何時需要 Excel AI、以檔案為基礎的分析工作流程,或改採可審閱的報告。
Claude in Google Sheets is useful for in-sheet work. This comparison shows when finance teams need Excel AI, a file-based analysis workflow, or a reviewable report instead.
A research-led guide to 8 spreadsheet-adjacent AI tools that separates publicly documented scope from capabilities that still need an in-product trial.
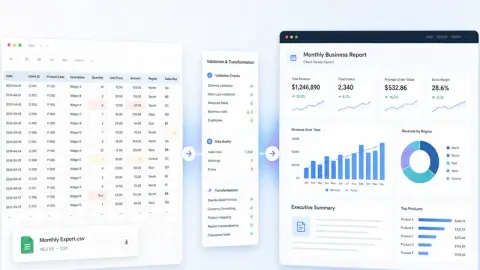
A CSV export is not a report. Here is a repeatable workflow for turning raw rows into a clean analysis report, executive summary, dashboard/report view, and shareable link stakeholders can actually review.
A practical step-by-step workflow for creating an Excel dashboard with AI, including source data checks, prompt examples, review criteria, and where RowSpeak fits.
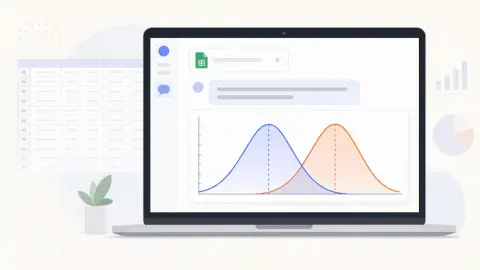
用兩種方式繪製鐘形曲線:在 Excel 中逐步建立,或將檔案上傳至 RowSpeak,用一句話要求生成。包含提示詞、審查檢查與常見錯誤。
Showing 18 of 24 stories
Load more storiesGet the top AI news and tools straight to your inbox every week.
Weekly · AI news
Join 15,000+ AI enthusiasts