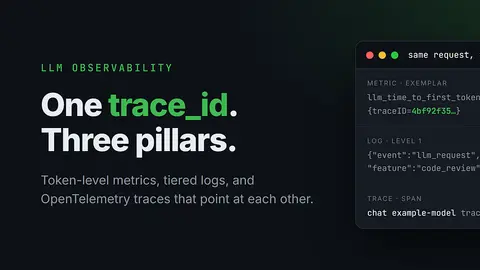
LLM Observability in Production: Metrics, Logs, Traces
Token-level metrics, tiered logs, and OTel traces joined by a single trace_id.Continue reading on Towards AI »
Towards AI1 min read
15 stories
Token-level metrics, tiered logs, and OTel traces joined by a single trace_id.Continue reading on Towards AI »
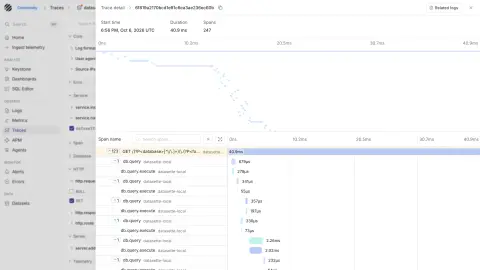
TIL: Using Parseable with Datasette for OpenTelemetry traces I saw Parseable in a Show HN today - it's a new observability platform with both an open source (AGPL) Rust implementation (a single ~180MB binary), an "Enterprise" version with extra features and a cloud hosted option.
Amazon ElastiCache for Valkey now publishes OpenTelemetry metrics to Amazon CloudWatch for your node-based clusters, and each metric carries attributes you can filter and aggregate on with Prometheus Query Language (PromQL) expressions. ElastiCache now offers two monitoring modes.
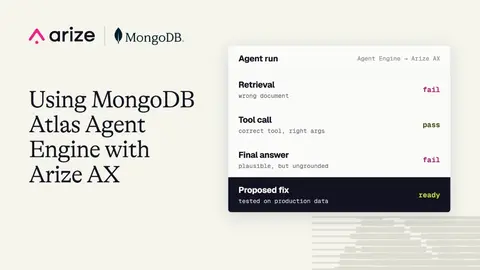
Agents built and deployed on MongoDB’s Atlas Agent Engine can export OpenTelemetry traces to Arize AX, where teams can inspect each run, evaluate both the outcome and execution path, and test fixes before redeploying.
Welcome to another edition of Road to KubeCon, where we’re tracking the major movements in the Kubernetes and cloud native The post OpenTelemetry and Prometheus are getting along. What’s still missing? appeared first on The New Stack.
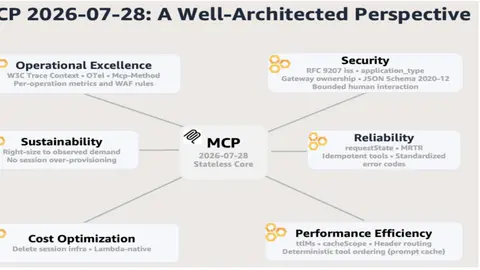
AWS details how the latest Model Context Protocol specification removes protocol-level sessions, sticky-session requirements, and session storage for remote MCP servers.
Release: datasette 1.0a41 Alec Garcia added support for OpenTelemetry to Datasette in this release. I've also refactored all of Datasette's modal dialogs to a single Web Component, which is now documented for other plugins to use.
First-class OpenTelemetry tracing for Rivet Actors and Rivet Workflows, with ray IDs and span links that correlate work across actors that live for days.
When an LLM call is slow, expensive, or wrong, you want to see the whole request: the prompt, the model, the tokens, the tool calls, the latency. If your traces live in one tool and your evaluation lives in another, that picture is split in two.
A practical guide to OpenTelemetry backends in 2026: who each one is actually for, how each one meters usage, and what changes when your app includes LLMs.
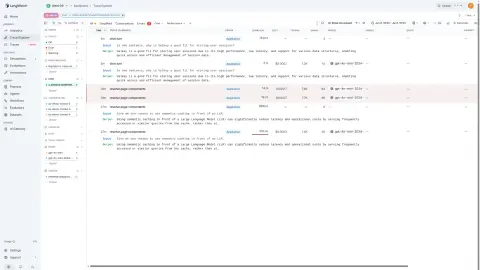
How BetterDB and LangWatch composed semantic-cache spans and LLM traces into one OpenTelemetry trace with zero integration code, and why OTel-native layers make it free.
bitdrift joins ClickHouse’s House Mates program with a mobile observability integration, bringing mobile-native telemetry, tracing, and debugging to ClickStack.
Agent failures rarely look like a single slow request. They look like loops: plan, call tool, retry, summarize, call another tool, exceed budget. OpenTelemetry’s GenAI semantic conventions give developers a portable way to trace those steps with model, token, workflow, and tool-call attributes.
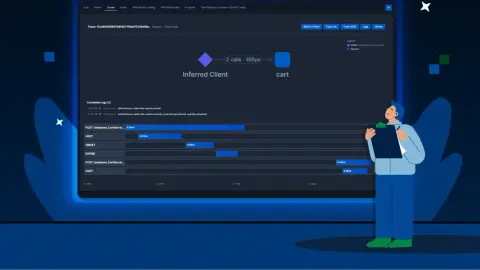
Let’s talk about why tracing from the mobile client is very difficult, especially at large scale. In any moderately large deployment, backend traces are sampled to control costs.
OpenTelemetry is an open-source framework and software including SDKs, tracing instrumentation, and a universal collector for generating, collecting, and exporting telemetry from applications and services.
Showing 15 of 15 stories
You're all caught up.
Get the top AI news and tools straight to your inbox every week.
Weekly · AI news
Join 15,000+ AI enthusiasts